the last question
Physics Go Brrr
Feb 17, 2026
Introduction
tinyphysics.py calls an ONNX transformer model 580 times per episode, autoregressively. One episode takes ~0.6 seconds. 5000 episodes takes ~50 minutes. Training a PPO policy over thousands of epochs at this speed is not feasible.
I got the epoch time down to 8 seconds for 5000 CSVs. ~375x speedup.
Part 1: Understanding the Baseline
The Architecture
The simulator has a simple loop:
for step in range(CONTEXT_LENGTH, len(data)):   # 580 steps (20 to 600)
    state, target = get_state_from_csv(step)
    action = controller.update(target, current_lataccel, state)  # your policy
    pred = onnx_model.predict(last_20_states, last_20_actions, last_20_preds)  # physics
    current_lataccel = clip(pred, current ± 0.5)
Each predict call:
- Tokenizes the last 20 predictions via
np.digitizeinto 1024 bins - Builds a
(1, 20, 4)float32 states tensor and(1, 20)int64 tokens tensor - Runs ONNX inference →
(1, 20, 1024)logits - Softmax on the last timestep → sample from distribution → decode token back to float
Autoregressive: step N’s prediction feeds into step N+1’s input. Can’t parallelize across timesteps. But you can parallelize across episodes.
The Cost Breakdown (measured on M4 Pro MacBook)
For a single episode (580 steps):
- 580 ONNX calls at ~0.5ms each = ~0.3s (81% of episode time)
- Tokenize + input building = ~10ms
- Softmax + sampling = ~36ms
- State lookups (pandas
.iloc, slicing) = ~11ms - Controller logic (PID baseline) = ~2ms
- Total with PID: ~0.33s per episode
With an RL policy controller, it’s ~0.6s per episode. 5,000 episodes sequentially: ~50 minutes.
Every episode is independent. The ONNX model processes (1, 20, 4) but it could just as easily process (5000, 20, 4). One fat call instead of 5,000 skinny ones.
Part 2: Batched Simulation (50 min → 40s)
The Rewrite
I built tinyphysics_batched.py, a drop-in replacement that runs N episodes in lockstep. Instead of:
for episode in 5000_episodes:
    for step in 580_steps:
        predict(1, 20, 4)  →  5000 × 580 = 2,900,000 ONNX calls
Now:
for step in 580_steps:
    predict(5000, 20, 4)  →  580 ONNX calls
Same total compute, 5000x fewer kernel launches. The ONNX model’s transformer handles the batch dimension natively.
Histories become (N, T) arrays instead of Python lists. State becomes (N, T, 3). Every operation (clip, append, slice) operates on arrays, not scalars.
The Parity Trap
Sounds simple. It wasn’t. The reference simulator has subtle behaviors:
- RNG seeding: Each episode seeds
np.random.seed(hash(filename)). Batched version needs per-episodeRandomStateobjects. - History management: Reference uses
.append()on lists. I use pre-allocated arrays with index writes. np.digitizebehavior:right=Truemeans “intervals closed on the right.” One wrong flag and every token shifts by one, and the autoregressive simulation diverges catastrophically over 500 steps.
Getting exact numerical parity took multiple iterations. A float32 vs float64 mismatch in token decoding caused the score to jump from 49.7 to 59.2. 20% regression from a precision bug in one line.
Result
5,000 episodes with PID controller: ~40 seconds on CPU (10 workers with multiprocessing). Down from ~50 minutes for 5000 CSVs. With the RL policy controller it’s slower (~80s for 1000 CSVs) because every step runs a neural net forward pass.
Speedup: ~75x
Part 2.5: The MacBook Cluster
With the RL policy controller, one training epoch with 1000 CSVs took ~90 seconds on the MacBook Pro. 82s for rollouts (the policy’s neural net forward pass dominates per-step time), 8s for PPO update. 1000 epochs = 24+ hours. I needed more data per epoch.
Then I looked at the spare MacBook Air sitting on my desk.
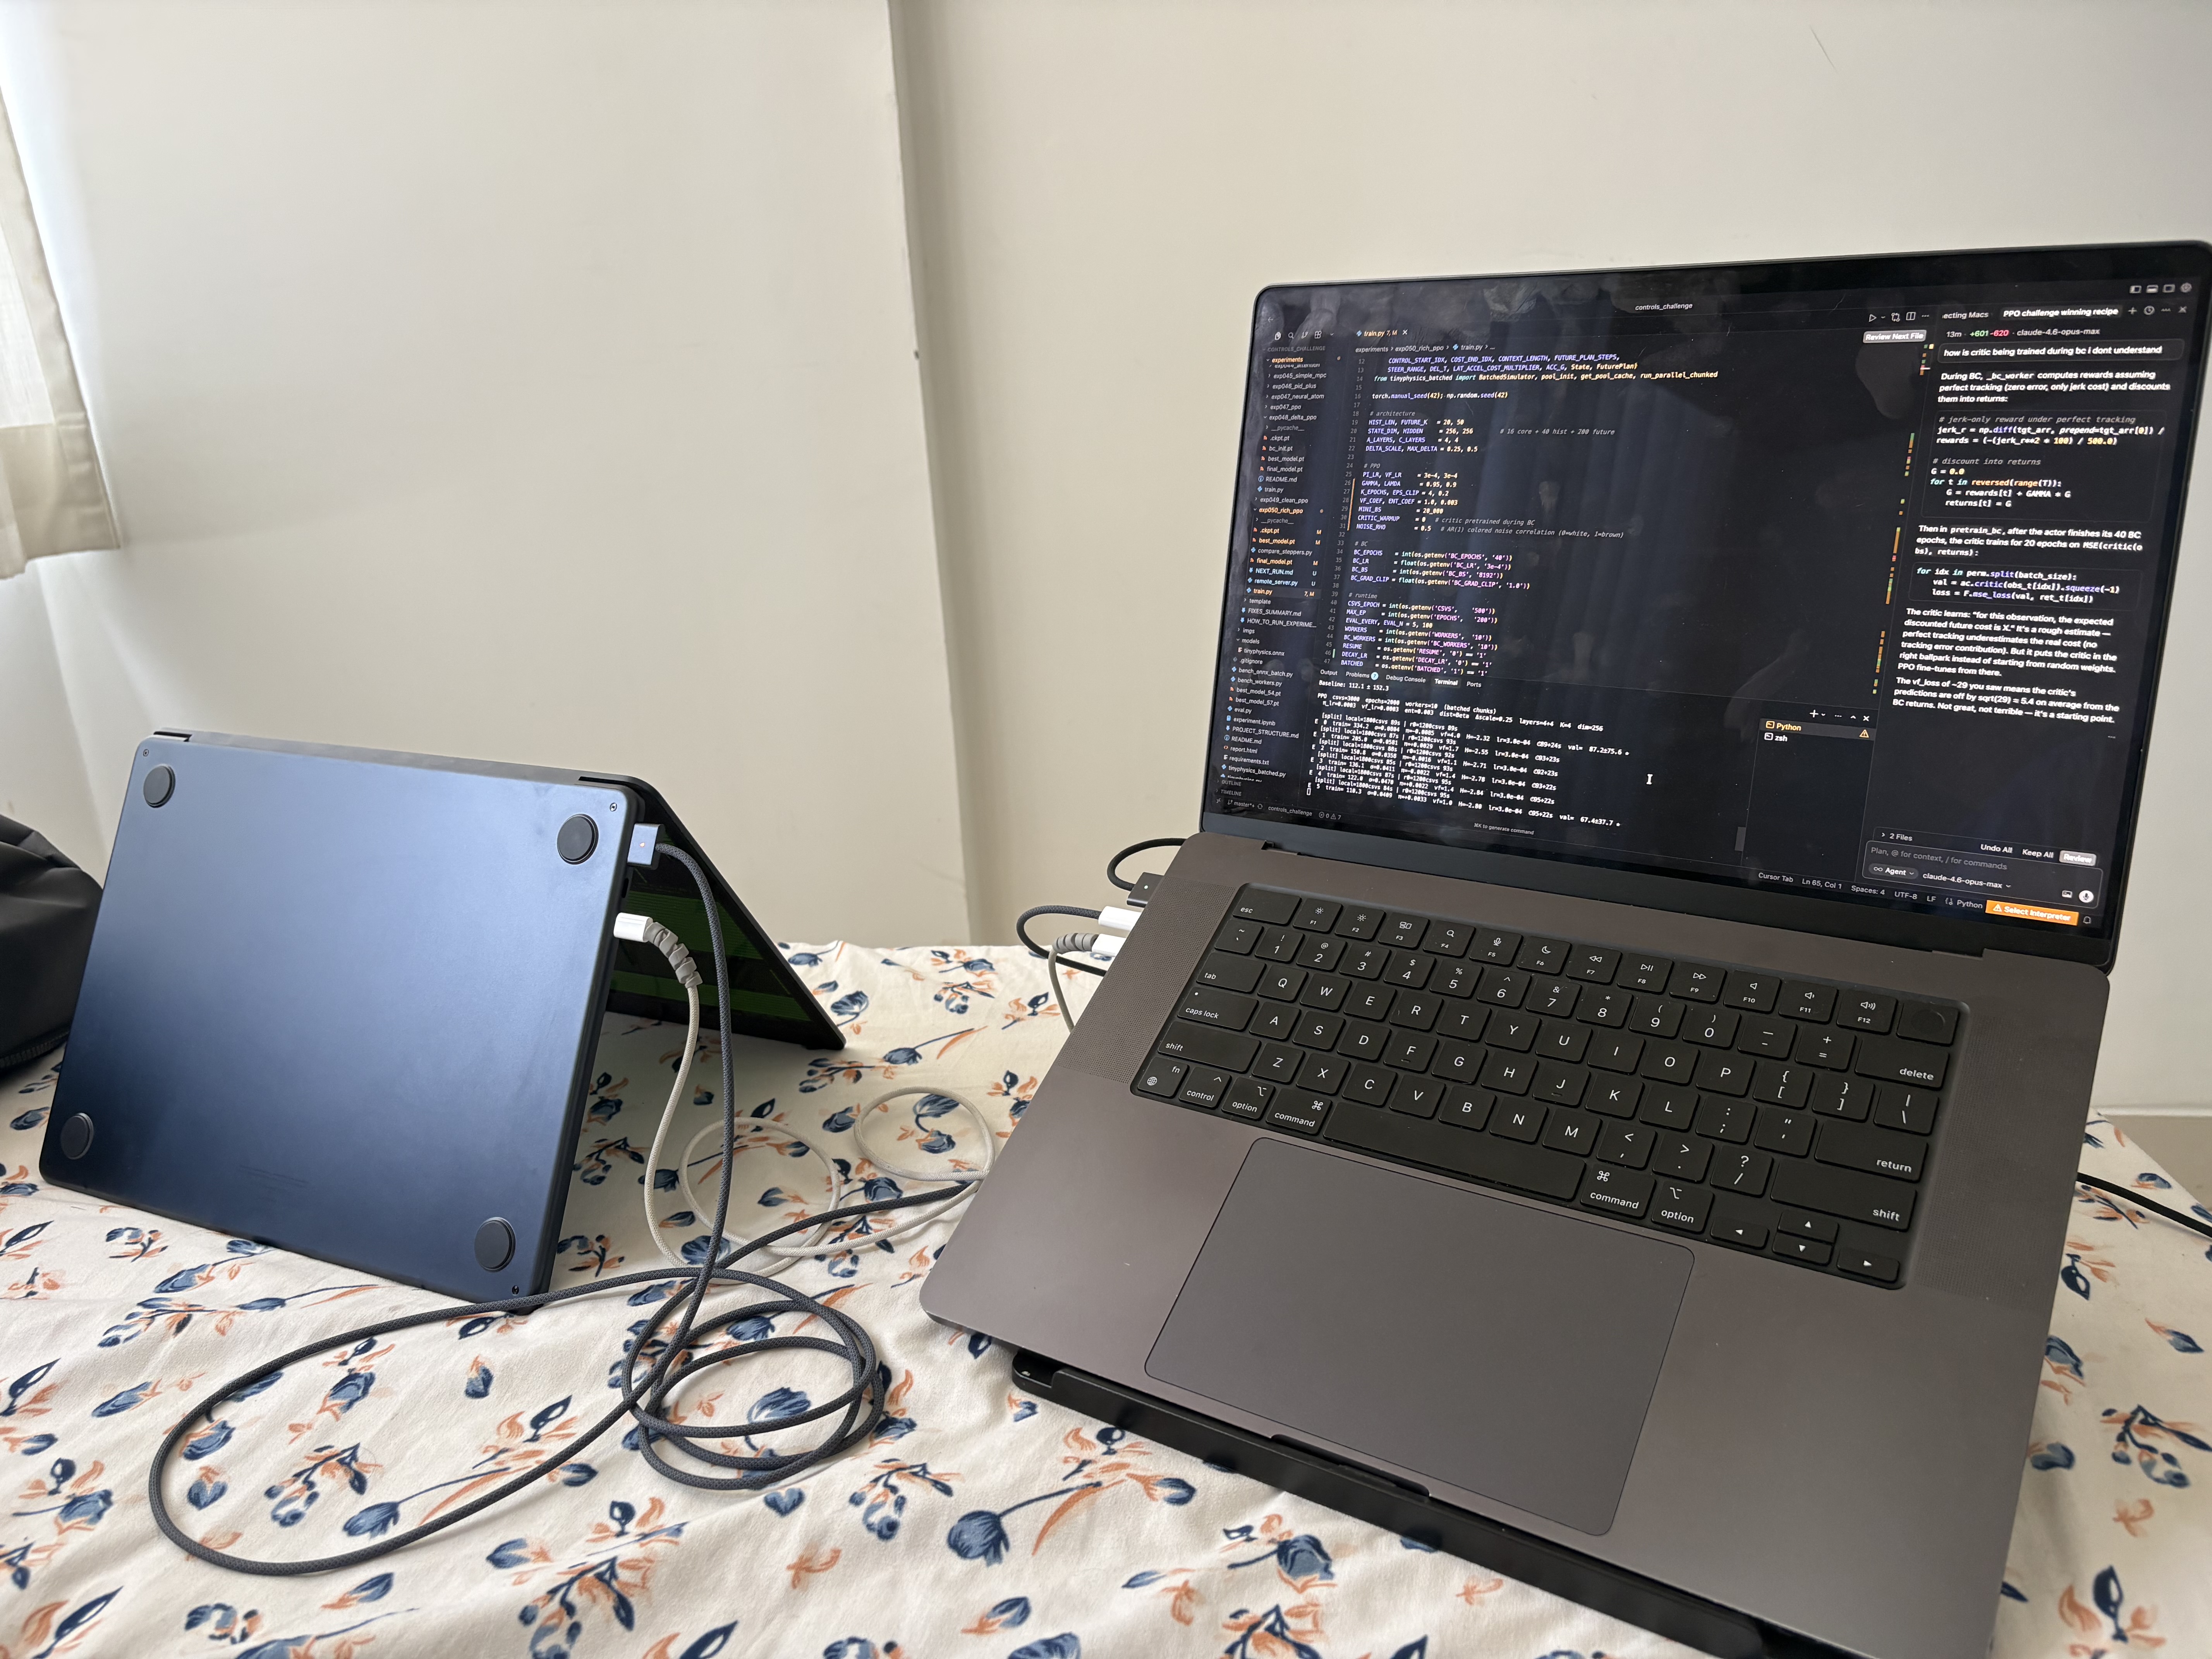
The USB-C Cluster
Two MacBooks connected via a Thunderbolt USB-C cable. No WiFi, just 40 Gbps point-to-point link over thunderbolt bridge.
First approach was SSH-based: each epoch, scp the checkpoint over, ssh to run remote_worker.py, scp results back. Worked, but the handshake + transfer overhead added up to ~5-10 seconds per epoch.
Replaced it with a persistent TCP server. The spare Mac ran remote_server.py listening on port 5555. Training script kept a persistent socket open, each epoch sent a pickle blob with checkpoint bytes and CSV file list. Server ran rollouts locally, streamed back a compressed NPZ. Zero handshake overhead after first connection.
The Load Balancing Problem
Naive 50/50 split (500 CSVs each) revealed the M4 Air is slow. No fan. Passive cooling. 6 of its 10 cores are efficiency cores, ~40% the speed of performance cores. Main Mac finishes in 40s and sits idle waiting for the Air to finish in 60s.
[split] local=500csvs 42s | r0=500csvs 58s ← main Mac waiting 16s
The fix: weighted splitting via a FRAC environment variable.
REMOTE_HOSTS=169.254.159.243 FRAC=1.4:1 CSVS=1000 WORKERS=10 python train.py
FRAC=1.4:1 means the local Mac gets 58% of CSVs, the remote gets 42%. Both finish around the same time. No idle waiting.
More Data, Not Faster Epochs
The distributed setup didn’t make 1000 CSVs twice as fast. The Air was too slow for that. But it doubled the data in the same wall time. CSVS=2000, main Mac processes ~1200 while the Air handles ~800. Same wall time as 1000 on one machine. Twice the training data per PPO update.
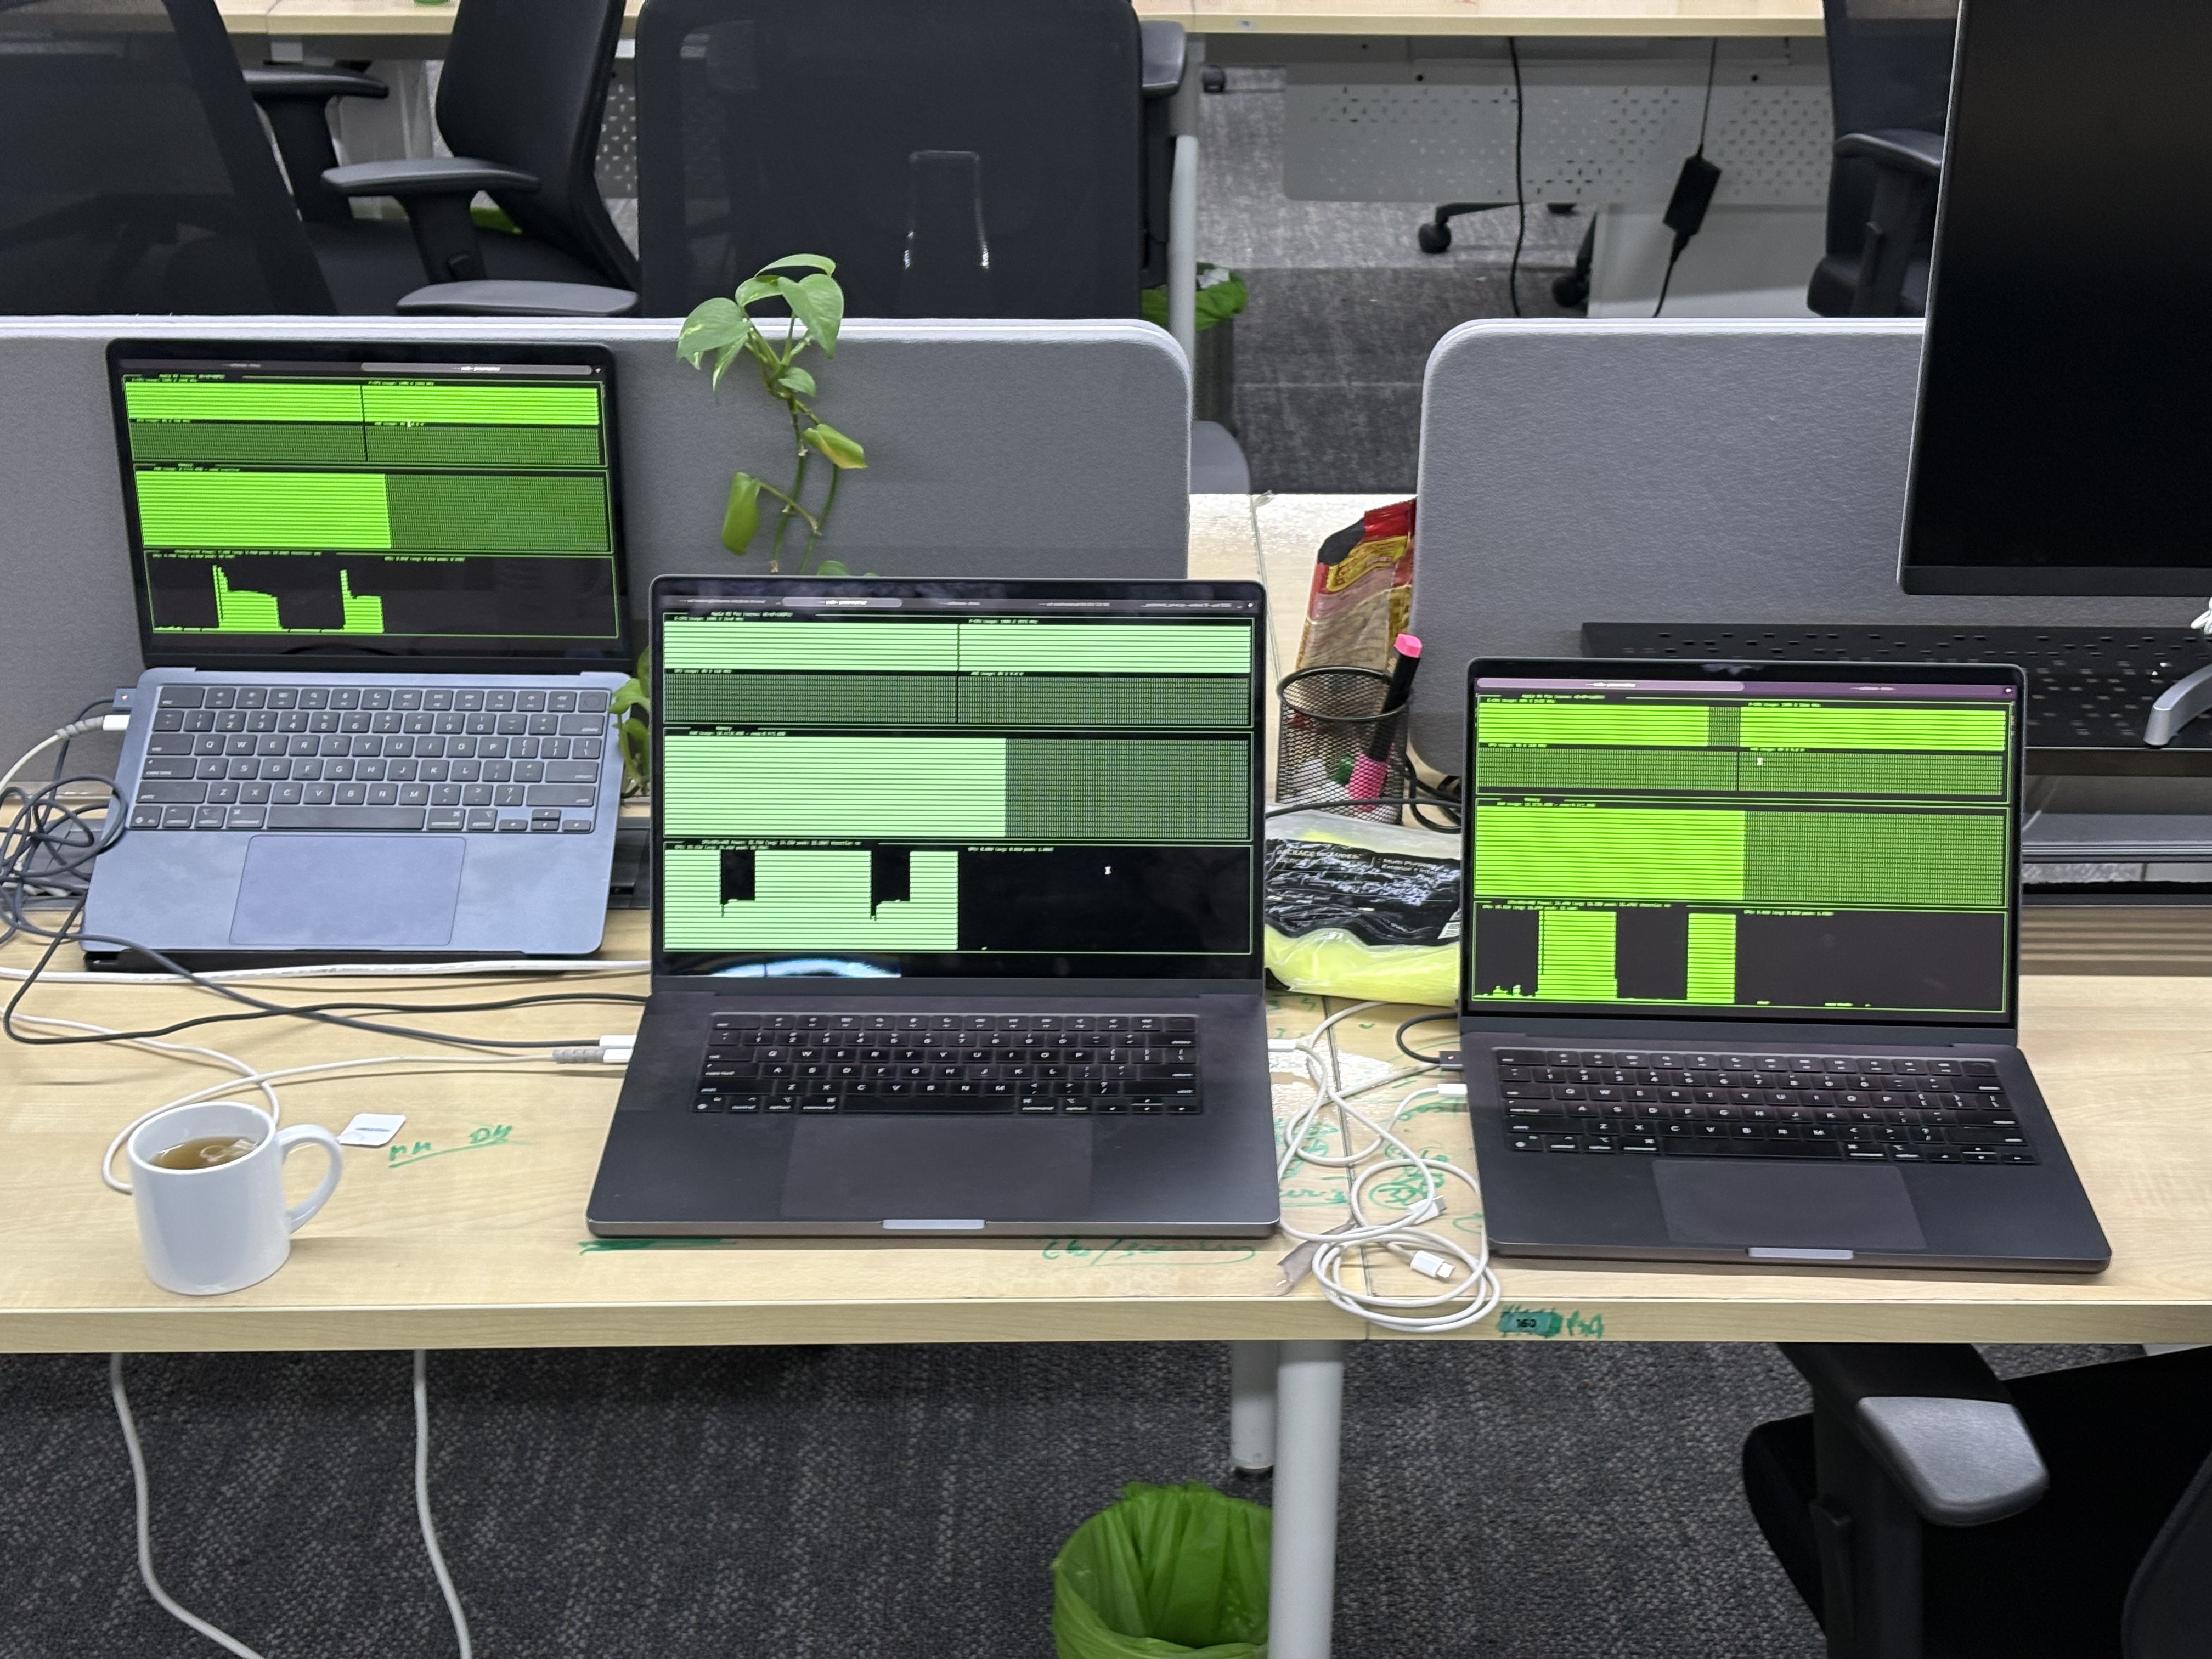
Three Macs, One Training Loop
Then came the question: can I daisy-chain three MacBooks?
The multi-remote code already supported it. REMOTE_HOSTS takes comma-separated IPs, each running its own remote_server.py:
REMOTE_HOSTS=169.254.159.243,192.168.1.42 FRAC=3.5:3.5:3 CSVS=3000 python train.py
Three MacBooks. One main (M4 Pro), two remotes (M4 Air + a friend’s machine). 3000 CSVs split proportionally. Training loop sends checkpoint bytes to both remotes in parallel, runs local rollouts simultaneously, merges when the slowest finishes.
[split] local=1050csvs 43s | r0=1050csvs 41s | r1=900csvs 44s
3000 CSVs in ~45 seconds. The same amount of data that would have taken 270 seconds on a single Mac.
Thermal Wall
The MacBook cluster had a shelf life. After 30+ minutes of sustained 100% CPU load, the fanless Air started thermal throttling. Epoch times crept from 45s to 55s to 65s. Even the Pro throttled slightly. Rubbing ice cubes wrapped in cloth on the Air helped (seriously). Band-aid. Pretty COOL.
E 0   ⏱45s     ← cold
E 25  ⏱55s     ← warm
E 50  ⏱65s     ← throttled
The cluster got me from random policy to val cost ~55. Then I needed real compute.
Cloud
First: Google Cloud, 48-core CPU instance. 4000 CSVs in ~35s seconds. MacBook cluster immediately obsolete.
But CPU bottleneck was fundamental. ONNX inference is sequential per episode (autoregressive), each worker occupies an entire core for ~0.5s. Cores scale linearly; GPUs scale with parallelism.
Then: Vast.ai, rented RTX 5060 Ti. The batched simulator rewrite (Part 3 onward) made the multi-machine approach irrelevant. Instead of distributing 5000 episodes across dozens of CPU cores, run them all in a single GPU batch. One ONNX call. One kernel launch. The “cluster” became a single GPU tensor.
The MacBook cluster was scrappy, held together by USB-C cables and pickle sockets. It got me from a random policy to a competitive one.
Part 3: Moving to GPU (40s → 20s rollout)
CPU multiprocessing hit a wall. 10 workers, each running a batched ONNX session, still 40s on rollouts. The ONNX model is a transformer. Running (5000, 20, 4) through a GPU should be nearly the same latency as (1, 20, 4).
ONNX Runtime CUDA EP
Swap the execution provider:
providers = ['CUDAExecutionProvider', 'CPUExecutionProvider']
sess = ort.InferenceSession(model_bytes, options, providers)
Single process. One ONNX session on GPU. 5,000 episodes batched. No multiprocessing.
IOBinding
Default ONNX GPU path: numpy array -> CPU staging buffer -> GPU -> inference -> GPU -> CPU staging -> numpy array. Every step. 580 times.
IOBinding lets you bind pre-allocated GPU tensors directly:
io = session.io_binding()
io.bind_input('states', 'cuda', 0, np.float32, shape, gpu_tensor.data_ptr())
io.bind_output('output', 'cuda', 0, np.float32, shape, out_gpu.data_ptr())
session.run_with_iobinding(io)
ONNX output writes directly into a persistent GPU tensor. Softmax and sampling happen on GPU via PyTorch. Only the final N sampled token indices come back to CPU.
GPU-Resident Tokenization
Original: np.clip -> np.digitize on CPU, copy to GPU.
GPU version: torch.clamp -> torch.bucketize, entirely on GPU. Gotcha: torch.bucketize(right=False) corresponds to np.digitize(right=True). Inverted semantics. Getting this wrong silently produces wrong tokens.
GPU-Resident Simulation Histories
The histories (action_history, state_history, current_lataccel_history) were numpy arrays on CPU. Each step, slice them, copy to GPU for ONNX, write prediction back to CPU.
Moving them to GPU tensors eliminated the per-step CPU<->GPU transfer:
self.action_history = torch.zeros((N, T), dtype=torch.float64, device='cuda')
self.state_history = torch.zeros((N, T, 3), dtype=torch.float64, device='cuda')
Slicing history[:, h-CL:h] produces a GPU tensor view. ONNX reads it directly. Prediction stays on GPU. Zero bus traffic.
Result
sim time: 17s → 10s. Total epoch: ~33s.
Compounded speedup: ~150x from original.
Part 4: The CSV Trap (33s → 20s per epoch)
Where Did 13 Seconds Go?
Rollout loop (ctrl + sim) took 20s. Epoch timer said 33s. 13 seconds lost to overhead I wasn’t measuring:
| Hidden Cost | Time | Cause |
|---|---|---|
preload_csvs |
~6s | Re-parsing 5000 CSVs via pandas every epoch |
reset() |
~3s | Allocating 60MB numpy, 5000 RNG objects, GPU transfers |
| Post-rollout | ~3s | Transposing 700MB obs array, 5000-iteration result loop |
save_ckpt |
~1s | torch.save to disk every epoch (not needed in GPU mode) |
CSVCache: Parse Once, Slice Forever
class CSVCache:
    def __init__(self, all_csv_files):
        self._master = preload_csvs(all_csv_files)  # one-time: ~47s at startup
        self._rng_all = precompute_all_rng(all_csv_files)

    def slice(self, subset_files):
        idxs = [self._file_to_idx[f] for f in subset_files]
        return {k: self._master[k][idxs] for k in keys}, self._rng_all[idxs]
47 seconds at startup. Then each epoch’s “CSV loading” is a numpy fancy-index operation: ~0.1 seconds.
The Data Dict on GPU
The simulator’s data dictionary (roll_lataccel, v_ego, a_ego, target_lataccel, steer_command) was read from CPU every step. Moved it to GPU:
self.data_gpu = {}
for k in data_keys:
    self.data_gpu[k] = torch.from_numpy(data[k]).cuda()
Now dg['target_lataccel'][:, step_idx] is a GPU tensor slice. No CPU involvement.
Result
13s of hidden overhead collapsed to <1s. Epoch time: 33s -> ~20s. The rollout itself was still ~20s (ctrl + sim unchanged), but the epoch no longer wasted half its time on data plumbing.
Part 5: All-GPU Controller (20s -> 12s rollout)
After all the sim optimizations:
ctrl = 9.5s sim = 10.2s total = 19.7s
Controller was still doing everything on CPU:
# Per step (old):
current_la = sim.current_lataccel.cpu().numpy()   # GPU → CPU
obs_buf = build_obs_numpy(target, current_la, ...)  # 20 numpy ops on (5000,)
obs_t = torch.from_numpy(obs_buf).to('cuda')       # CPU → GPU
a, b = ac.beta_params(obs_t)                        # GPU inference
raw = (2*x - 1).cpu().numpy()                       # GPU → CPU
action = np.clip(...)                                # CPU
return action  # will be sent back to GPU for sim
Three CPU<->GPU round-trips per step. 580 steps. 5,000 episodes. All because obs building was in numpy.
Full GPU Controller
Every buffer moved to GPU:
# Ring buffers
h_act   = torch.zeros((N, HIST_LEN), dtype=torch.float64, device='cuda')
h_act32 = torch.zeros((N, HIST_LEN), dtype=torch.float32, device='cuda')
h_lat   = torch.zeros((N, HIST_LEN), dtype=torch.float32, device='cuda')
h_error = torch.zeros((N, HIST_LEN), dtype=torch.float32, device='cuda')
obs_buf = torch.empty((N, OBS_DIM), dtype=torch.float32, device='cuda')

# Training data collection
all_obs = torch.empty((max_steps, N, OBS_DIM), dtype=torch.float32, device='cuda')
all_raw = torch.empty((max_steps, N), dtype=torch.float32, device='cuda')
Obs building becomes pure torch:
target     = dg['target_lataccel'][:, step_idx]     # GPU slice
current_la = sim.current_lataccel                     # GPU tensor
v2 = torch.clamp(v_ego * v_ego, min=1.0)
k_tgt = (target - roll_la) / v2
obs_buf[:, 0] = target / S_LAT
obs_buf[:, 1] = current_la / S_LAT
# ... all 256 obs dimensions built on GPU ...
obs_buf.clamp_(-5.0, 5.0)

with torch.inference_mode():
    a_p, b_p = ac.beta_params(obs_buf)  # already on GPU, no transfer
Controller receives (step_idx, sim) and returns a GPU tensor. Zero CPU touches per step.
Rollout Loop Signature
# Old (CPU):
controller_fn(step_idx, target, current_la_numpy, state_dict, future_plan)

# New (GPU):
controller_fn(step_idx, sim)  # sim.data_gpu, sim.current_lataccel are GPU tensors
PPO.update: GPU Tensors In
Training data already on GPU. No more np.concatenate + torch.FloatTensor().to(DEV):
if isinstance(all_obs[0], torch.Tensor):
    obs_t = torch.cat(all_obs, dim=0)  # already on GPU
    raw_t = torch.cat(all_raw, dim=0).unsqueeze(-1)
Result
ctrl = 1.3s sim = 10.1s total = 11.4s
ctrl: 9.5s -> 1.3s.
Part 6: Compound Effect
| Step | What Changed | Rollout Time (5000 eps) | Epoch Time | Cumulative Speedup |
|---|---|---|---|---|
| Baseline | Sequential single-episode | ~50 min | N/A | 1x |
| Batched CPU | N episodes in lockstep, multiprocessing | ~40s | ~60s | 75x |
| MacBook Cluster | 3 Macs, persistent TCP, weighted splits | ~45s (3000 CSVs) | ~55s | 3x data/time |
| GPU ONNX | CUDAExecutionProvider, single process | ~25s | ~45s | 120x |
| IOBinding + GPU tokenize | Zero-copy ONNX I/O, torch.bucketize | ~20s | ~40s | 150x |
| GPU-resident histories | Histories as CUDA tensors | ~20s | ~33s | 150x |
| CSVCache | Parse once at startup | ~20s | ~20s | 150x (epoch: 150x) |
| GPU controller + data_gpu | All obs/ctrl/data on GPU | ~12s | ~12s + 19s PPO | 250x |
| TensorRT FP16 | Fused kernels, engine caching | ~8s | ~8s + 3s PPO | 375x |
| Final shave-offs | GPU randperm, GPU cost, GPU stats, 100K mini-batch | ~8s | ~8s + 3s PPO | ~375x |
50 minutes to 8 seconds. Each layer was necessary. GPU-resident histories are pointless without IOBinding. GPU controller is pointless without data_gpu. CSVCache is invisible in the rollout timer but halves epoch time.
Part 7: What I Got Wrong
The Float32 Decode Bug
When I moved tokenization to GPU, I decoded sampled tokens using float32 bins:
sampled = self._bins_f32_gpu[sample_tokens].double() # WRONG
Original uses float64 bins. The float32->float64 round-trip loses ~7 decimal digits of precision. Over 500 autoregressive steps, this compounds. Score jumped from 49.7 to 59.2. 20% regression from one line.
Fix: decode with float64 bins.
sampled = self._bins_gpu[sample_tokens] # float64, matches reference
torch.bucketize vs np.digitize
They have inverted right semantics:
np.digitize(x, bins, right=True)=torch.bucketize(x, bins, right=False)
Getting this wrong shifts every token by one position. Simulation diverges silently. No error, just wrong physics.
The RNG Parity Bug
I pre-generated random values for all T steps. But the reference seeds the RNG at CONTEXT_LENGTH and only generates values for steps CL through T. Pre-generating for steps 0 through T wastes CL random draws, shifting the entire sequence.
Fix: generate only T - CL values, index by step_idx - CL.
The /venv Incident
While trying to install TensorRT on a rented GPU instance, I deleted /venv to free disk space. That was the system Python installation. The virtualenv’s symlink to /venv/bin/python3 broke instantly.
Part 8: TensorRT (10s -> 5s)
The sim phase, 580 sequential ONNX forward passes, was 10s and looked like the irreducible floor. But CUDA EP executes each op as a separate kernel. TensorRT fuses layers, auto-tunes for the specific GPU, and runs FP16 where safe.
ONNX Runtime supports TensorRT as an execution provider:
providers = []
if os.environ.get('TRT') == '1':
    providers.append(('TensorrtExecutionProvider', {
        'trt_fp16_enable': True,
        'trt_engine_cache_enable': True,
        'trt_engine_cache_path': '/tmp/trt_cache',
        'trt_max_workspace_size': str(2 << 30),  # 2GB
    }))
providers.append(('CUDAExecutionProvider', {...}))
First epoch pays a ~30s TRT engine compilation cost. After that, the cached engine loads in <1s.
FP16 LayerNorm
TensorRT warned about FP16 overflow in layernorm nodes after self-attention. It automatically forced those layers back to FP32. No accuracy loss, no manual intervention needed.
Result
sim = 10.1s → 5.1s (TRT, after engine cache warm)
Sim floor nearly halved. For N=5000, total rollout: ~12s -> ~8s.
Part 9: Final Shave-offs
With TRT handling the sim floor, I audited every remaining CPU<->GPU transfer:
| Transfer | Location | Size | Direction |
|---|---|---|---|
torch.randperm(N) |
PPO update mini-batch loop | 1.6M int64 | CPU→GPU (hundreds per update) |
pred.cpu().numpy() |
compute_cost() |
(N, 400) float | GPU→CPU |
rew_2d.cpu().numpy() |
gae_gpu ret_rms update |
(N, S) float | GPU→CPU |
Fix 1: GPU randperm
# Before:
for idx in torch.randperm(N).split(MINI_BS):

# After:
for idx in torch.randperm(N, device=obs_t.device).split(MINI_BS):
~1.6M transitions, K=4 PPO epochs = hundreds of implicit CPU->GPU index transfers eliminated.
Fix 2: GPU compute_cost
# Before:
pred = pred.cpu().numpy()
lat_cost = np.mean((target - pred)**2, axis=1) * 100

# After:
lat_cost = (target_gpu - pred_gpu).pow(2).mean(dim=1) * 100
jerk = torch.diff(pred_gpu, dim=1) / DEL_T
jerk_cost = jerk.pow(2).mean(dim=1) * 100
total = lat_cost * LAT_ACCEL_COST_MULTIPLIER + jerk_cost
return {'total_cost': total.cpu().numpy()}  # (N,) not (N, 400)
Transfers 3 vectors of size N instead of an (N, 400) matrix.
Fix 3: GPU running stats
RunningMeanStd was pulling the entire (N, S) reward tensor to CPU just for mean and variance:
# Before: 6.4MB GPU->CPU transfer
self._ret_rms.update(rew_2d.detach().cpu().numpy().ravel())

# After: compute moments on GPU, transfer 2 scalars
flat = rew_2d.reshape(-1)
self._ret_rms.update_from_moments(flat.mean().item(), flat.var().item(), flat.numel())
Fix 4: Larger Mini-batches
MINI_BS 20K -> 100K. optimizer.zero_grad(set_to_none=True) to skip memset.
Result
Before:  ⏱6+3s  (N=4000)   per-csv: 2.25ms
After:   ⏱8+3s  (N=5000)   per-csv: 2.20ms
Modest. The 5s TRT sim floor dominates at this point.
Part 10: Where the Time Goes Now
Epoch: ~8s rollout + ~3s PPO update = ~11s (N=5000)
Breakdown:
- sim = 5-6s: 580 sequential TensorRT forward passes. Hard floor, autoregressive can’t be parallelized across timesteps.
- ctrl = 1.2s: All-GPU obs building + policy inference. 580 steps x 2.1ms each.
- overhead < 0.5s: GPU data slicing from cache, history init, cost computation.
PPO update (3s) processes ~2.5M datapoints through 4 epochs of mini-batch SGD with 100K batch size.
Part 11: Lessons
1. Measure before you optimize. I spent time on IOBinding reuse and pre-allocated GPU buffers that saved ~0.5s. Meanwhile, CSV re-parsing was silently burning 6s per epoch. Timing prints inside the rollout loop were misleading because they didn’t capture setup cost outside the loop.
2. Precision is not optional. Autoregressive models amplify tiny numerical differences. A float32 decode corrupted the entire simulation trajectory. “Close enough” doesn’t exist when you’re feeding predictions back as inputs 500 times.
3. The bus is the bottleneck. Biggest category of optimization was eliminating CPU<->GPU transfers. Moving the controller from CPU to GPU turned 9.5s into 1.3s by removing three round-trips per step.
4. Each layer enables the next. GPU-resident histories enabled IOBinding. IOBinding enabled zero-copy predict. data_gpu enabled the all-GPU controller. CSVCache enabled fast reset. Can’t cherry-pick, they compound.
5. The reference implementation is the spec. Every time I diverged from tinyphysics.py’s exact behavior (RNG consumption pattern, tokenizer right flag, float precision) the scores broke. The batched version must produce identical trajectories to the reference, or the policy learns on wrong rewards.
Conclusion
- Batch episodes into one ONNX call (75x)
- MacBook cluster over Thunderbolt, persistent TCP, weighted splits (3x data throughput)
- GPU ONNX with CUDAExecutionProvider (1.6x)
- IOBind inputs and outputs to GPU memory (1.25x)
- GPU-resident histories to eliminate per-step transfers (1.0x, but enabled everything after)
- Cache CSVs to eliminate per-epoch I/O (1.7x on epoch time)
- GPU controller to eliminate all CPU numpy ops (7x on ctrl time)
- GPU training data to eliminate post-rollout transpose and CPU->GPU copy (1.5x on PPO time)
- TensorRT FP16 with engine caching (2x on sim time)
- Final shave-offs: GPU randperm, GPU cost, GPU running stats, larger mini-batches (1.1x)
~375x on rollout (50 min -> 8s for 5000 episodes).
50 minutes to 8 seconds. Off-by-one RNG bugs, inverted boolean flags, a deleted system Python, thermal-throttled MacBook Airs, and pickle blobs flying over Thunderbolt cables.