the last question
tinygrad PPO on CPU and Metal
Aug 23, 2026
One measured tinygrad CPU PPO update takes 234.56 ms. PyTorch takes 10.58 ms. Direct tests localize most tinygrad time to generated matrix functions.
We have not separated the remaining difference into instruction choice, memory access, data packing, or processor use.
Workload
- Apple M4, macOS 26.3, arm64
- PyTorch 2.8.0
- tinygrad
5b60a09ab0a7f20c3426e505251c48cac020d1fa - Lunar Lander
fbe3c420f12221c707ae1d3d282511fe96adde3d - CPU and Metal
- float32
- Actor and critic have four hidden layers of width 128
- PPO batch size 10,000
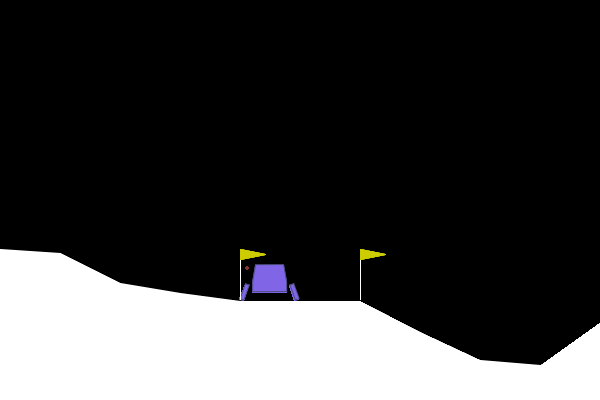
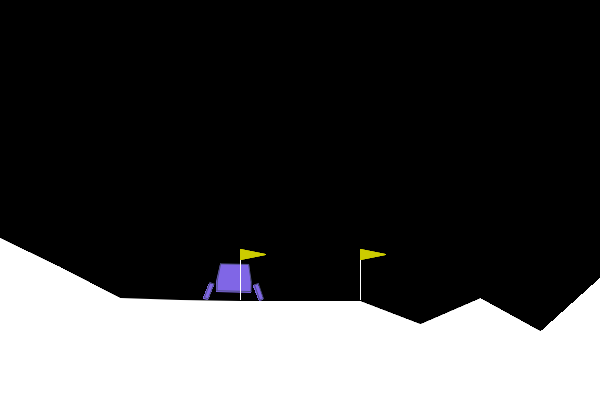
Both four-environment trainers solve the task with stochastic evaluation.
| Implementation | Stochastic evaluation | Captured return |
|---|---|---|
| PyTorch | 249.9 | 271.8 |
| tinygrad | 228.6 | 272.9 |
Controlled measurement
Each result is the median of five paired fresh processes. Order alternates. Inputs and initialized parameters match. Each timed operation synchronizes.
TinyJit capture, compilation, and five warmup updates occur before ten timed PPO updates.
| Operation | PyTorch | tinygrad | Paired ratio |
|---|---|---|---|
| Complete PPO update | 10.582 ms | 234.562 ms | 22.1× |
The update includes forward, backward, gradient clipping, and Adam. Matrix tests use 30 samples after ten warmup operations.
| Operation | PyTorch | tinygrad | Paired ratio |
|---|---|---|---|
(4×128) @ (128×128) |
0.0015 ms | 0.0844 ms | 55.9× |
(10000×128) @ (128×128) |
0.2260 ms | 6.2470 ms | 27.7× |
(128×10000) @ (10000×128) |
0.2328 ms | 10.2067 ms | 43.7× |
tinygrad also reports direct generated-kernel time:
| Operation | Synchronized TinyJit | Direct kernel |
|---|---|---|
(4×128) @ (128×128) |
0.0844 ms | 0.0212 ms |
(10000×128) @ (128×128) |
6.2470 ms | 6.1975 ms |
(128×10000) @ (10000×128) |
10.2067 ms | 10.0797 ms |
Dispatch is material for the small matrix. It is less than two percent of either large matrix time.
PyTorch calls APL_sgemm through Apple Accelerate. tinygrad executes generated CPU kernels.
Both matrix paths match a float64 reference. The largest absolute error is 0.001536. The first three PPO losses differ by at most 2.265e-6.
One update through tinygrad
The controlled PPO step builds one lazy graph for the loss and Adam updates. Immediately before realization, it contains 1,250 UOps and 68 requested outputs.
Realization schedules and compiles that graph into 150 program calls from 65 unique rendered programs. TinyJit stores this ordered call list and replays it with new input buffers.
The first two calls are the actor and critic input layers. Each takes 10,000 states, an 8×128 weight matrix, and a 128-value bias. tinygrad renders each layer as one C function that contains the matrix reduction and bias addition.
Each captured call records its buffer shapes, input and output slots, launch size, applied schedule options, and rendered source. The complete pipeline trace contains all 150 calls and 65 sources.
Kernel attribution
VIZ needs HCQ2=1 for CPU kernel timestamps. HCQ2 changes execution, so this profile supplies attribution only.
One marked HCQ2 step contains 150 kernels. Its CPU kernel timeline totals 234.46 ms. These shares describe the HCQ2 run, not normal execution.
| Kernel family | Time | Calls | Kernel share |
|---|---|---|---|
r_2500_32_4_4_32_4 |
139.22 ms | 12 | 59.39% |
r_32_32_4_4_2500_4 |
77.43 ms | 6 | 33.03% |
| All other kernels | 17.81 ms | 132 | 7.58% |
The first family contains forward and input-gradient work. The second contains weight-gradient work.
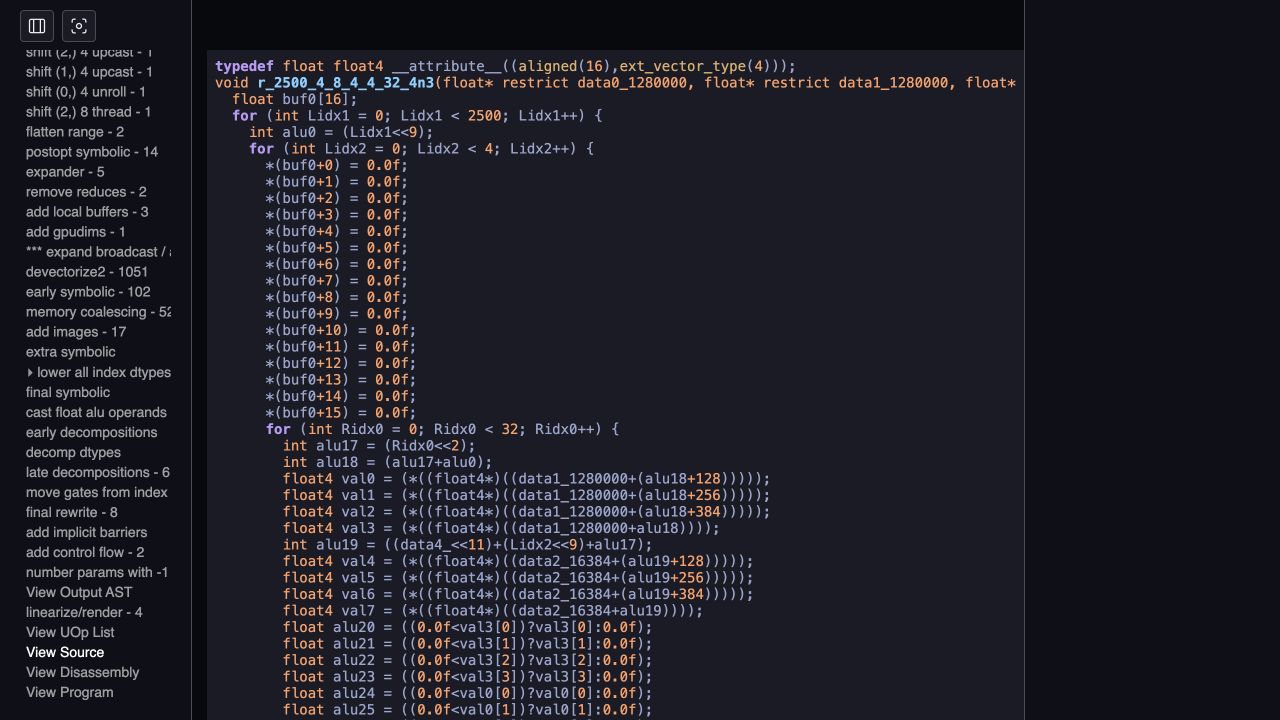
Clang emits vector loads and fmla v*.4s instructions for the inspected float4 kernel.
CPU programs
PyTorch calls the precompiled Apple BLAS path. tinygrad generates one C function for the operation.
A runtime sample of the Apple BLAS worker contains SME fmopa instructions. Clang lowers the inspected tinygrad function to NEON fmla instructions.
The Apple BLAS hot loop and complete tinygrad C function contain the exact extracted code.
Direct CPU function test
A direct C runner gives both functions identical aligned buffers. It uses ten warmup calls and 50 timed calls in five alternating fresh processes.
| Function | Median | Throughput |
|---|---|---|
Apple cblas_sgemm |
0.229 ms | 1428.2 GFLOPS |
| tinygrad generated C, beam schedule | 2.753 ms | 119.0 GFLOPS |
| tinygrad generated C, default schedule | 6.272 ms | 52.2 GFLOPS |
The paired default-to-BLAS ratio is 27.6 times. Beam makes the generated function 2.25 times faster, but it remains 12.2 times slower than BLAS.
The report retains every process median. -O2, -O3, and -O3 -ffast-math give similar tinygrad times in this test.
CPU schedule search
BEAM=1 selects a different schedule before timing. The default forward kernel uses a 4×4 output tile. Beam selects 5×16.
The direct function becomes 2.25 times faster. Two complete PPO sessions improve by 2.60 and 2.86 times. Tile selection therefore explains part of tinygrad’s CPU time.
Clang lowers the default inner loop to 16 NEON fmla instructions. It lowers the beam inner loop to 20 NEON fmla instructions. Neither function contains fmopa.
Metal programs
The same synchronized matrix test ran on PyTorch MPS and tinygrad Metal.
| Path | Median | Five process medians |
|---|---|---|
| PyTorch MPS | 0.4273 ms | 0.4156, 0.9094, 0.4036, 0.4370, 0.4273 ms |
| tinygrad Metal | 0.9002 ms | 0.9002, 1.0712, 0.4602, 0.8184, 1.0281 ms |
The paired ratios range from 1.14 to 2.41. This run is too variable for a precise Metal ratio. tinygrad emits simdgroup matrix operations. PyTorch delegates to MPSGraph.
The complete tinygrad Metal function and controlled Metal results contain the exact evidence.
Boundary
The measured CPU limit is inside the generated dense matrix implementation. The direct test removes framework overhead and JIT replay from this comparison.
Tile selection explains a 2.25-times factor in the direct function. It does not explain the remaining 12.2-times gap to Apple BLAS.
The generated tinygrad functions use NEON fmla. The sampled Apple BLAS loop uses SME fmopa. This is an observed difference, not an established cause.
The remaining gap can include instruction choice, loop structure, data packing, cache behavior, and processor use. The measurements do not assign costs to these factors.
Evidence
- Controlled runner
- Controlled matrix results
- Controlled PPO results
- Fresh upstream kernel profile
- Apple BLAS hot loop
- tinygrad CPU source
- tinygrad Metal source
- Controlled Metal results
- Actor inference results
- Direct CPU function runner
- Direct CPU function results
- Beam-selected tinygrad C
- Beam-selected generated assembly